Normal Mechanisms
One broad objective in the Wilber laboratory is to understand the normal function of the parietal-hippocampal network that has been implicated in both mental and age-related cognitive disorders. The brain network that is critical for generating a “sense of location” has been the focus of a great deal of research but a less understood function of this system is to “recalibrate” when there is a conflict with the external environment (e.g., when getting reoriented after being lost or when you exit the subway in a new part of a city with which you are familiar). Landmarks can be used to perform this calibration; however, they are initially perceived in body-centered (egocentric) coordinates and evidence suggests that the internal map of the environment is represented in world-centered (allocentric) coordinates. Our previous research has confirmed theoretical and computational models describing the function of a parietal-hippocampal system for translating between body-centered and world-centered representations of landmarks (Wilber et al., 2014) and provided new insight into the anatomy of this network by characterizing connection densities in several of the key parts of this network (Wilber et al., 2015).
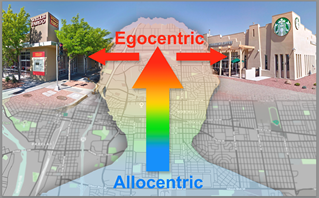
Coordination between allocentric (map-like) and body-centered (egocentric) frames of reference. Our brain performs navigational computations, sometimes behind the scenes in map-like or allocentric coordinates; however our interactions with the world ar body-centered or egocentric by nature (e.g., we turn right at a particular intersection). Therefore, a fundamental problem when navigating our environment is coordinating between allocentric and egocentric frames of reference. For example, when driving through a common intersection in a city and selecting the appropriate action for that intersection given the current route and goals (e.g., turn right to get coffee versus turn left to go to the bank).
Recently, we extended these findings to show that these systems are embedded in modules that encode a specific movement state (Wilber et al., 2017). We also have developed and made freely available a novel method for building whole-brain automated atlases of connection densities using retrograde tracing and automated neuronal segmentation (software).
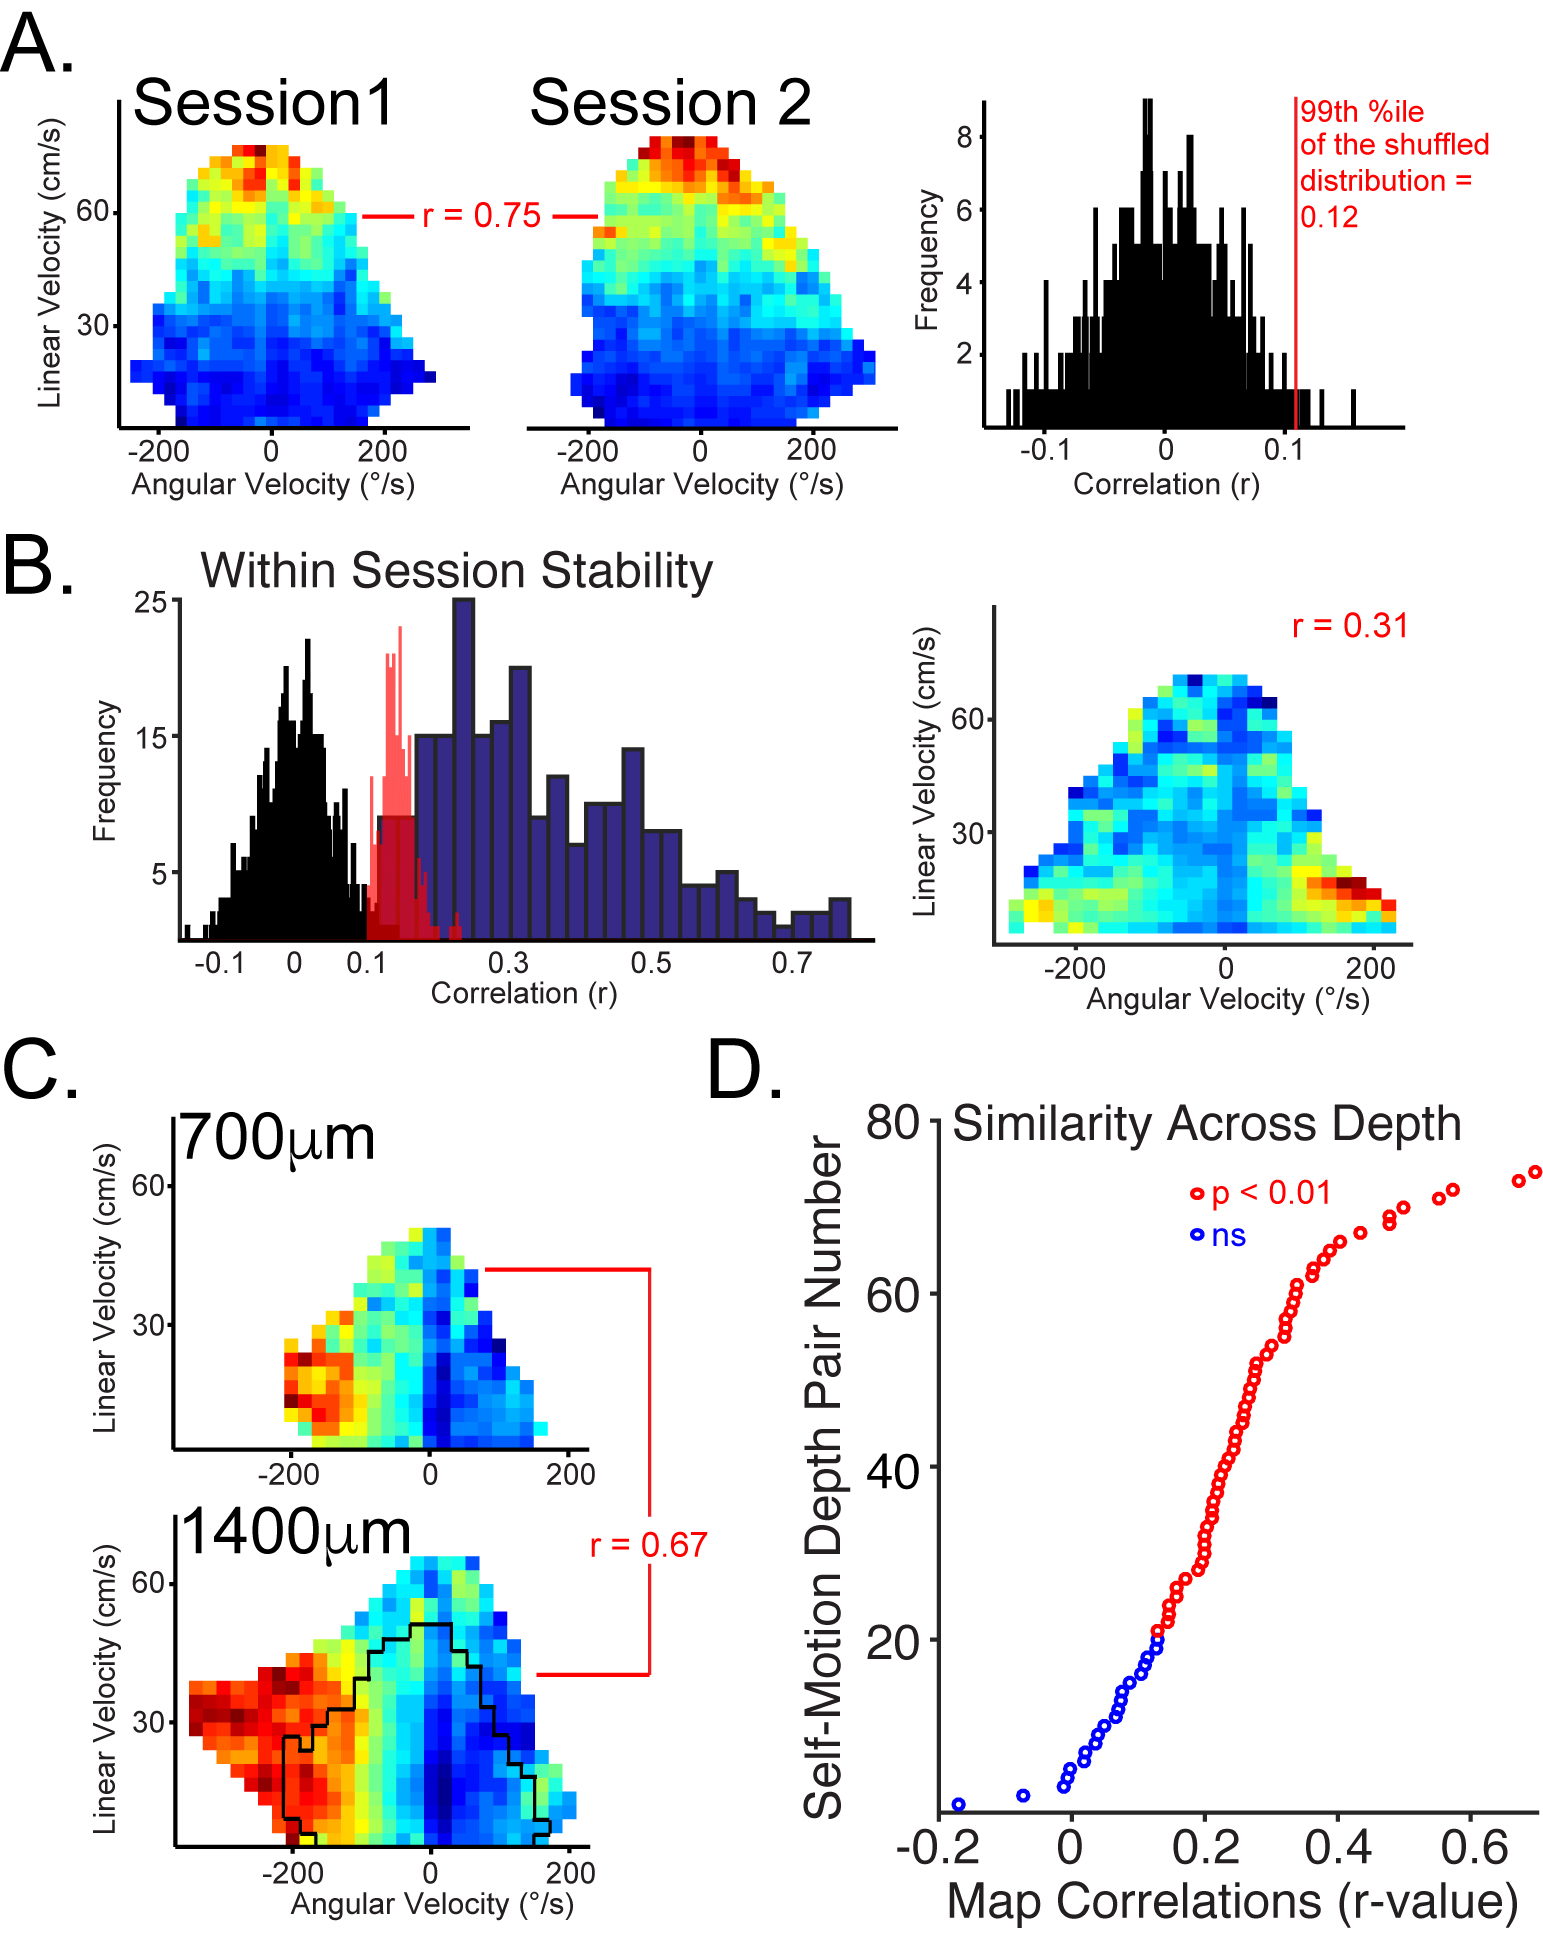
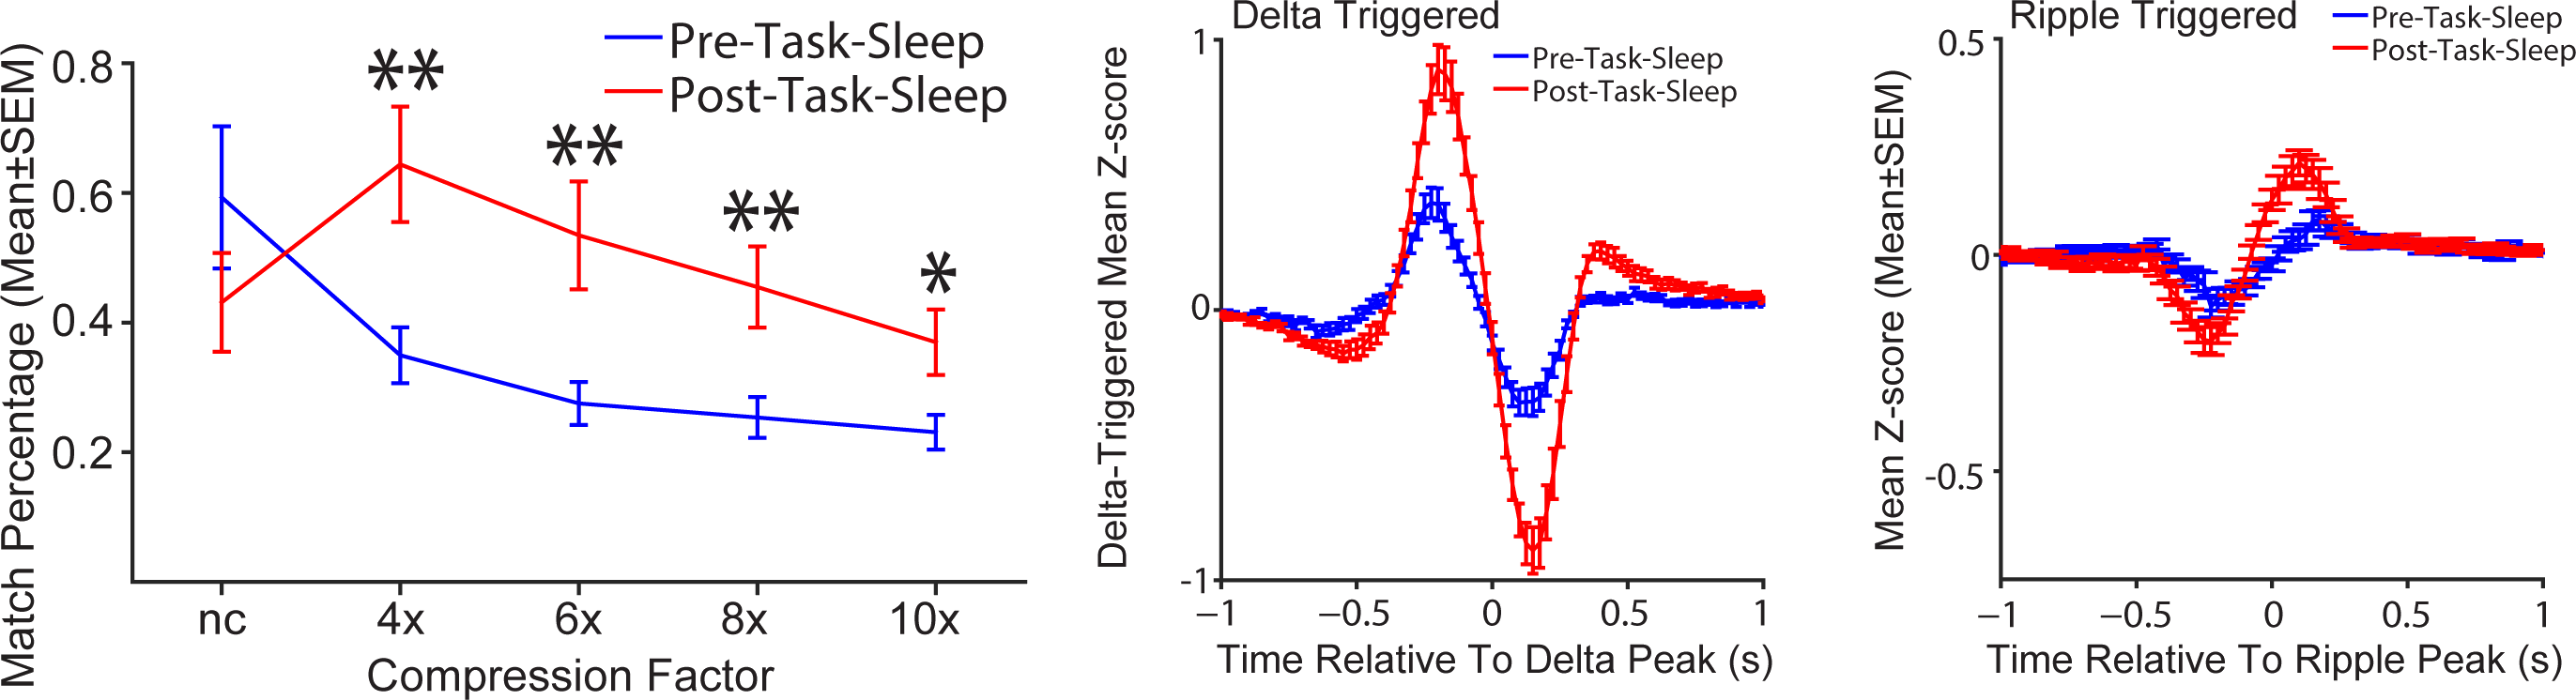
Our approach is to study both normal and diseased systems in parallel. This approach has proven fruitful. For example, we discovered modular encoding that is consistent across cortical laminae in parietal cortex (above and below) and demonstrated interactions between modules in the form of memory replay in normal animals. This work was published in the journal Neuron.
Disease-Related Perturbations
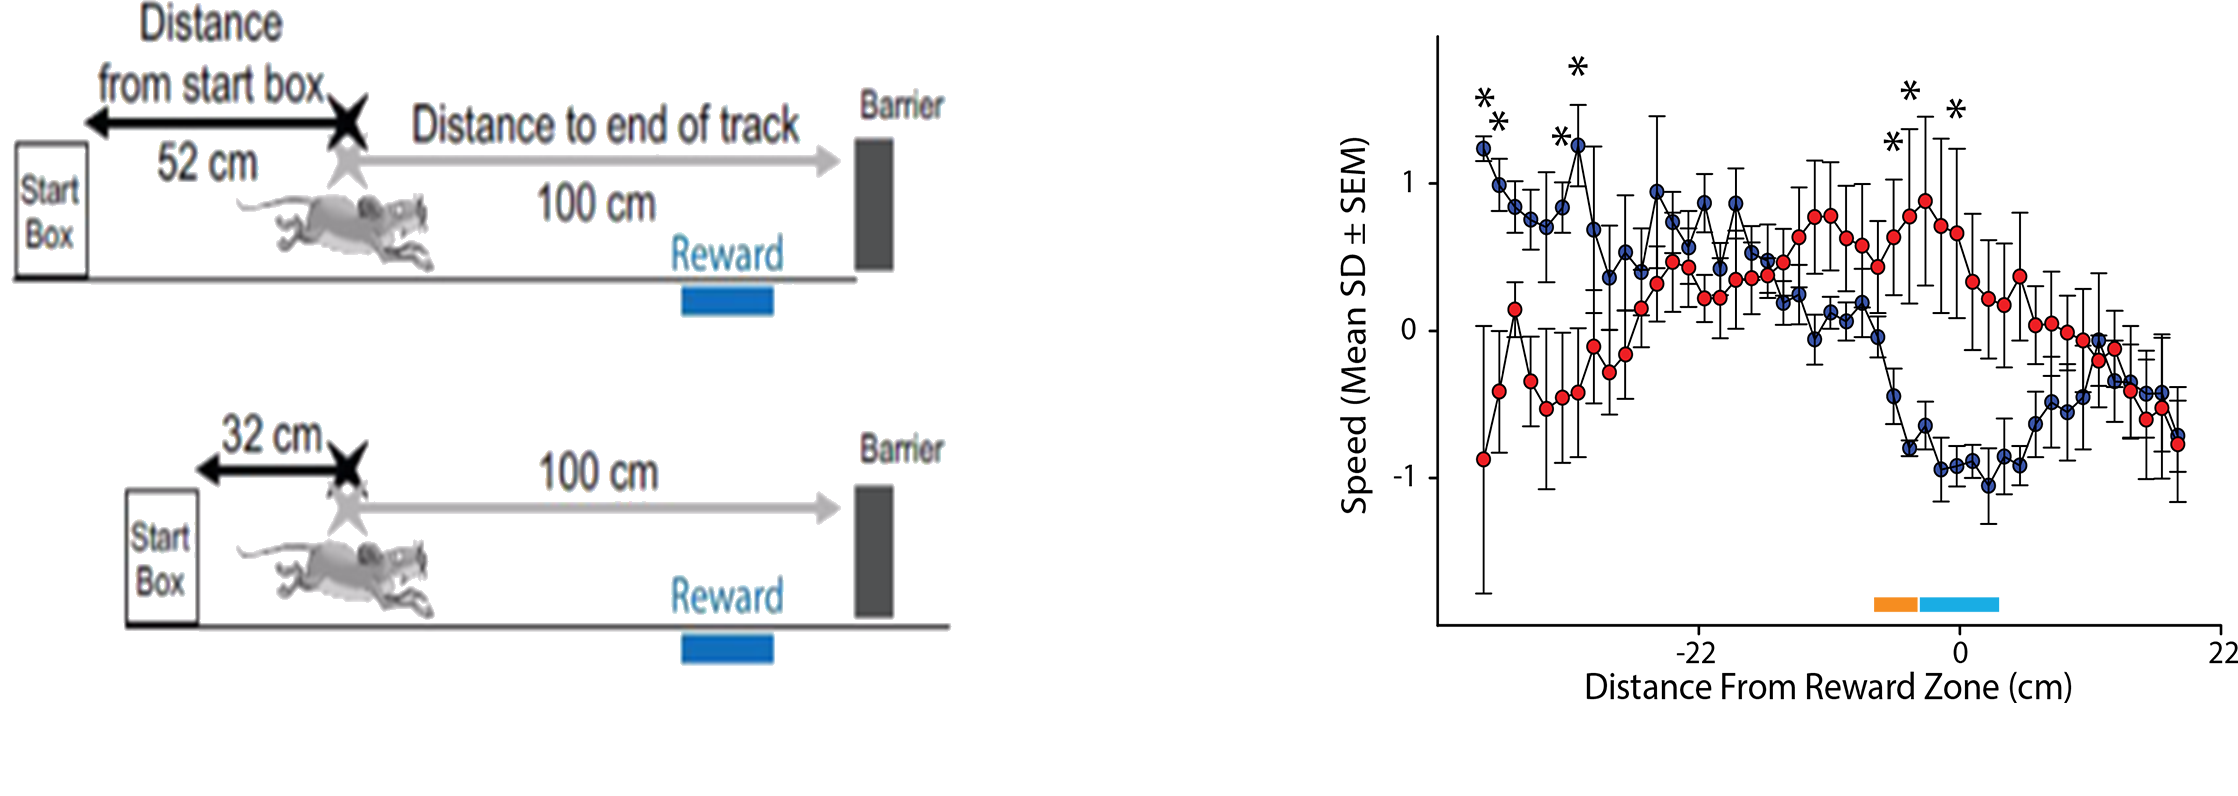
Current work in the laboratory is focused on understanding how brain circuits are involved in spatial orientation, alterations of learning and memory by neonatal perturbations, mental and neurological disorders. For example, we recently found that mouse models of Alzheimer’s are impaired at using cues in a room to figure out where their spatial location is by finding an unmarked location after we perform a manipulation to get the mice “lost” (blue bar; above; adapted from Rosenzweig et al., 2003). We are currently exploring these behavioral impairments in several different ways. For example, we are attempting to mimic impairments with circuit specific manipulations to the underlying neural network. Also, we are analyzing data from high-density recordings in the underlying neural network to look for impaired spatial learning and memory and also to look for impaired memory reactivation.
Future Directions
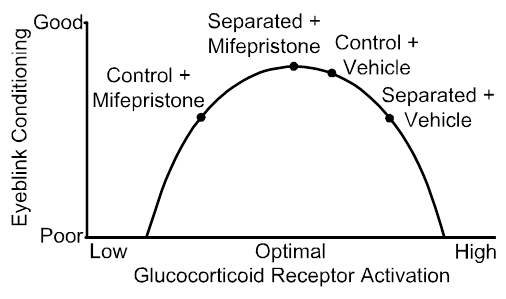
These areas of focus are designed to advance our progress towards a long-term goal to use maternal separation as a model to assess the contribution of neonatal stress to the development of mental and age-related cognitive disorders. Previously, we used a model of adverse early experience, maternal separation, and a simple type of motor learning, eyeblink conditioning, to assess neonatal stress programming of adult learning and memory (e.g., Wilber et al., 2007, 2010, 2011) and precisely describe a model for maternal separation induced impairments in this form of learning. The culmination of this work was an infusion study in which we demonstrated that blocking glucocorticoid receptors that were over-expressed as a result of maternal separation improved performance; however, blocking the same receptors in controls impaired performance (below). As a first step towards our long-term goal, we have begun looking for maternal separation induced changes in the brain network for performing coordinate transformation between person-centered and world-centered representations of the external environment
Approaches
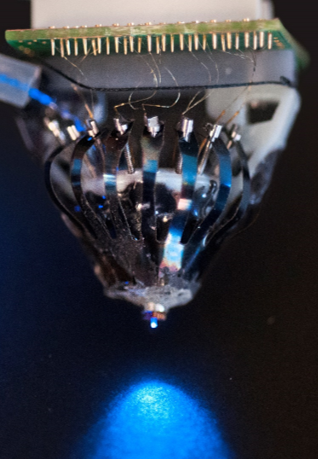
Custom recording arrays for high-density electrophysiology:
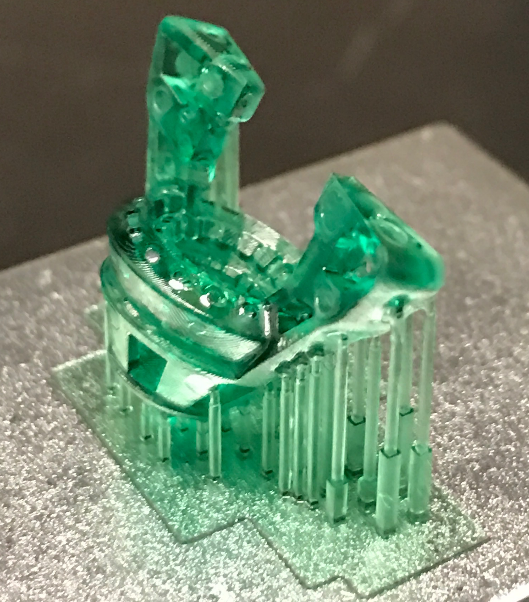
We 3D print a base (left), then use this to hand-build recording arrays (right) custom-designed to allow us to monitor many single cells in multiple brain regions, while simultaneously recording population-related neural activity (derived from local field potential recordings) either alone or in conjunction with one or both techniques described below. The drive shown is designed to be very light for recordings in mice (< 5g). Larger recording arrays are used with rats.
Manipulating Circuits to Understand Networks:
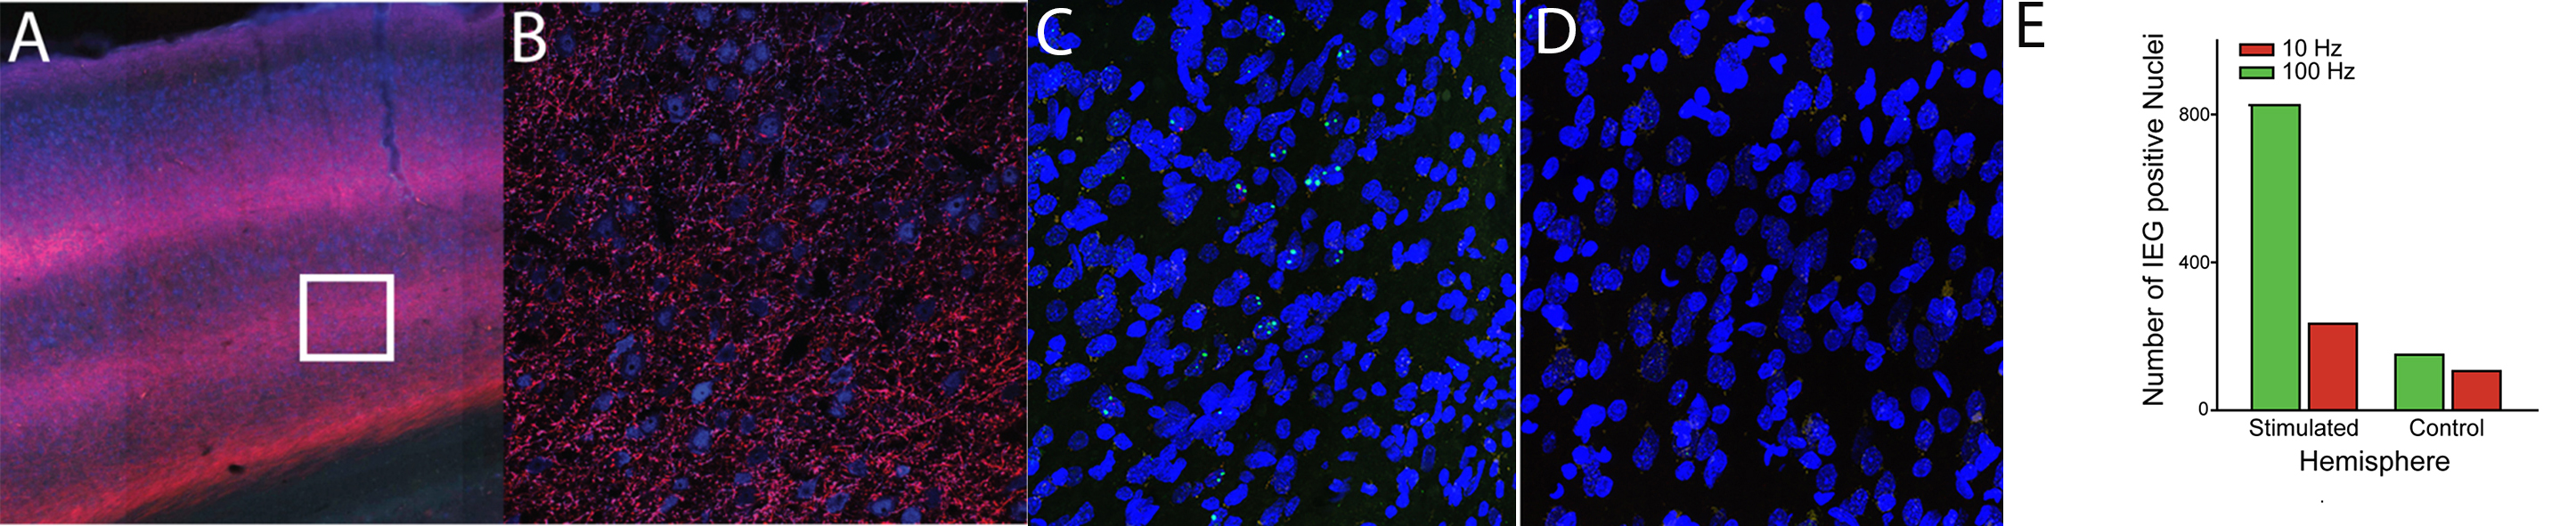
Two examples of this approach are shown. Example of a circuit manipulation designed to further our understanding of a brain network that includes the parietal cortex (above). In addition, an example of how we can measure these manipulations is shown. Immediate early gene work is done as a collaboration.
Whole Brain Connectivity, activation, and marker of interest profiling
We are using a high throughput slide scanner in conjunction with block-face images taken while sectioning tissue to generate 3D whole-brain reconstructions of a variety of products including retrograde tracers and markers of disease progression. These reconstructions are done in a semi-automated and quantitative fashion by automatically segmenting cell bodies and quantifying the amount of product of interest (fluorescence) in an all or none fashion. To do this we use hand counts to determine an ideal threshold for “positive” cells or neurons (Mesina et al., 2016).
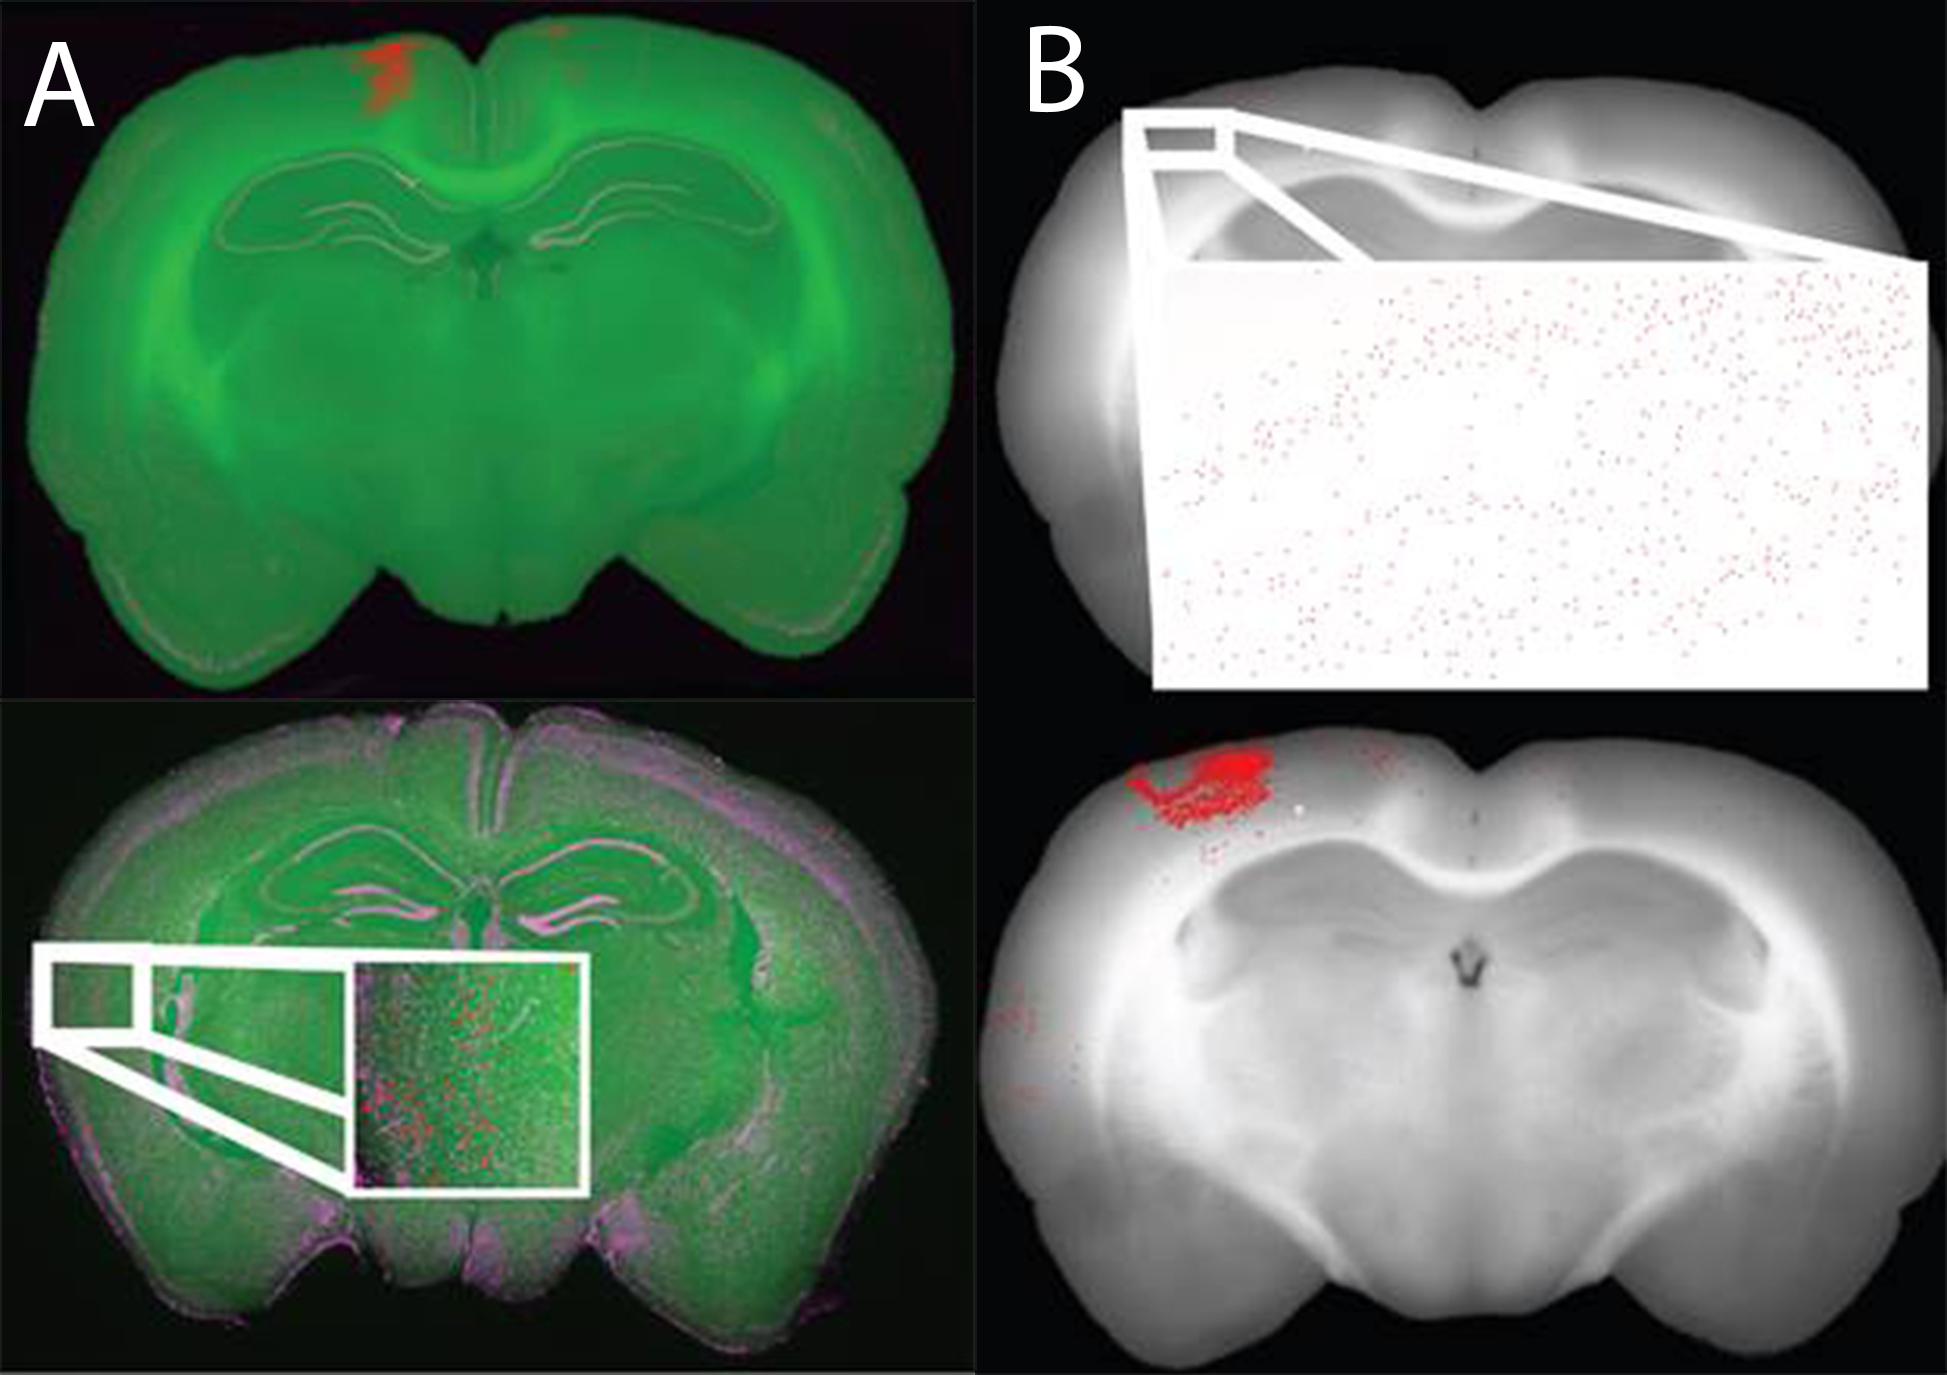
Registered data is stored in one of two formats, either with a single-pixel colored to represent a “positive” cell (top) or with a large marker covering many pixels and indicating the location of “positive” cells (bottom). The larger markers are easier to see and thus ideal for subjective viewing of registered data. The single colored pixel method is ideal for data analyses and quantification.